CSH's Use of Datadog in the Server Room
 Joe Abbate
February 20, 2023
Joe Abbate
February 20, 2023
As a student organization, we try to provide our members with tools and experience that will apply to the real world. When it comes to our server room, we wanted a mainstream location to monitor all of our nodes, containers, and virtual machines that keep us going. With the generous donation of Datadog software, we are able to do this using industry-level tools.
What is Datadog?
Datadog provides system and security monitoring to multiple machines, display them in a unified format, and provide alerts for system administrators to see. An Agent is installed on all machines, and these agents communicate to the Datadog servers with data. This data can be compiled into dashboards that provide network-wide statistics, or be used to alert us via Slack.
How do we use it?
Machine Management
All agents on phyisical or virtual machines are installed on our machines via Puppet, which is our preferred method of system management. Once the agent is installed, we receive data on that machine’s usage, uptime, and potential security issues. For containers, we run an OKD cluster that has Datadog’s implementation installed. This allows the agent to monitor our containers alongside the bare metal machines. This way, if there happens to be a security issue within a container, it can be identified before it can potentially break out or cause issues.
Website Automation/Checks
Alongside getting statistics from machines, we use Datadog to ensure our websites are functional. We run a lot of websites that are both public and private, so being alerted when these run into an issue is a big plus. The two ways we do this are API checks and workflow checks. In API checks, a Datadog agent reaches out to a specific API on a website and ensures it gets an OK response. If not, it will trigger an alert. In a workflow check, an agent will attempt to load a website like a user and go through a common activity to ensure the user experience is also functional.
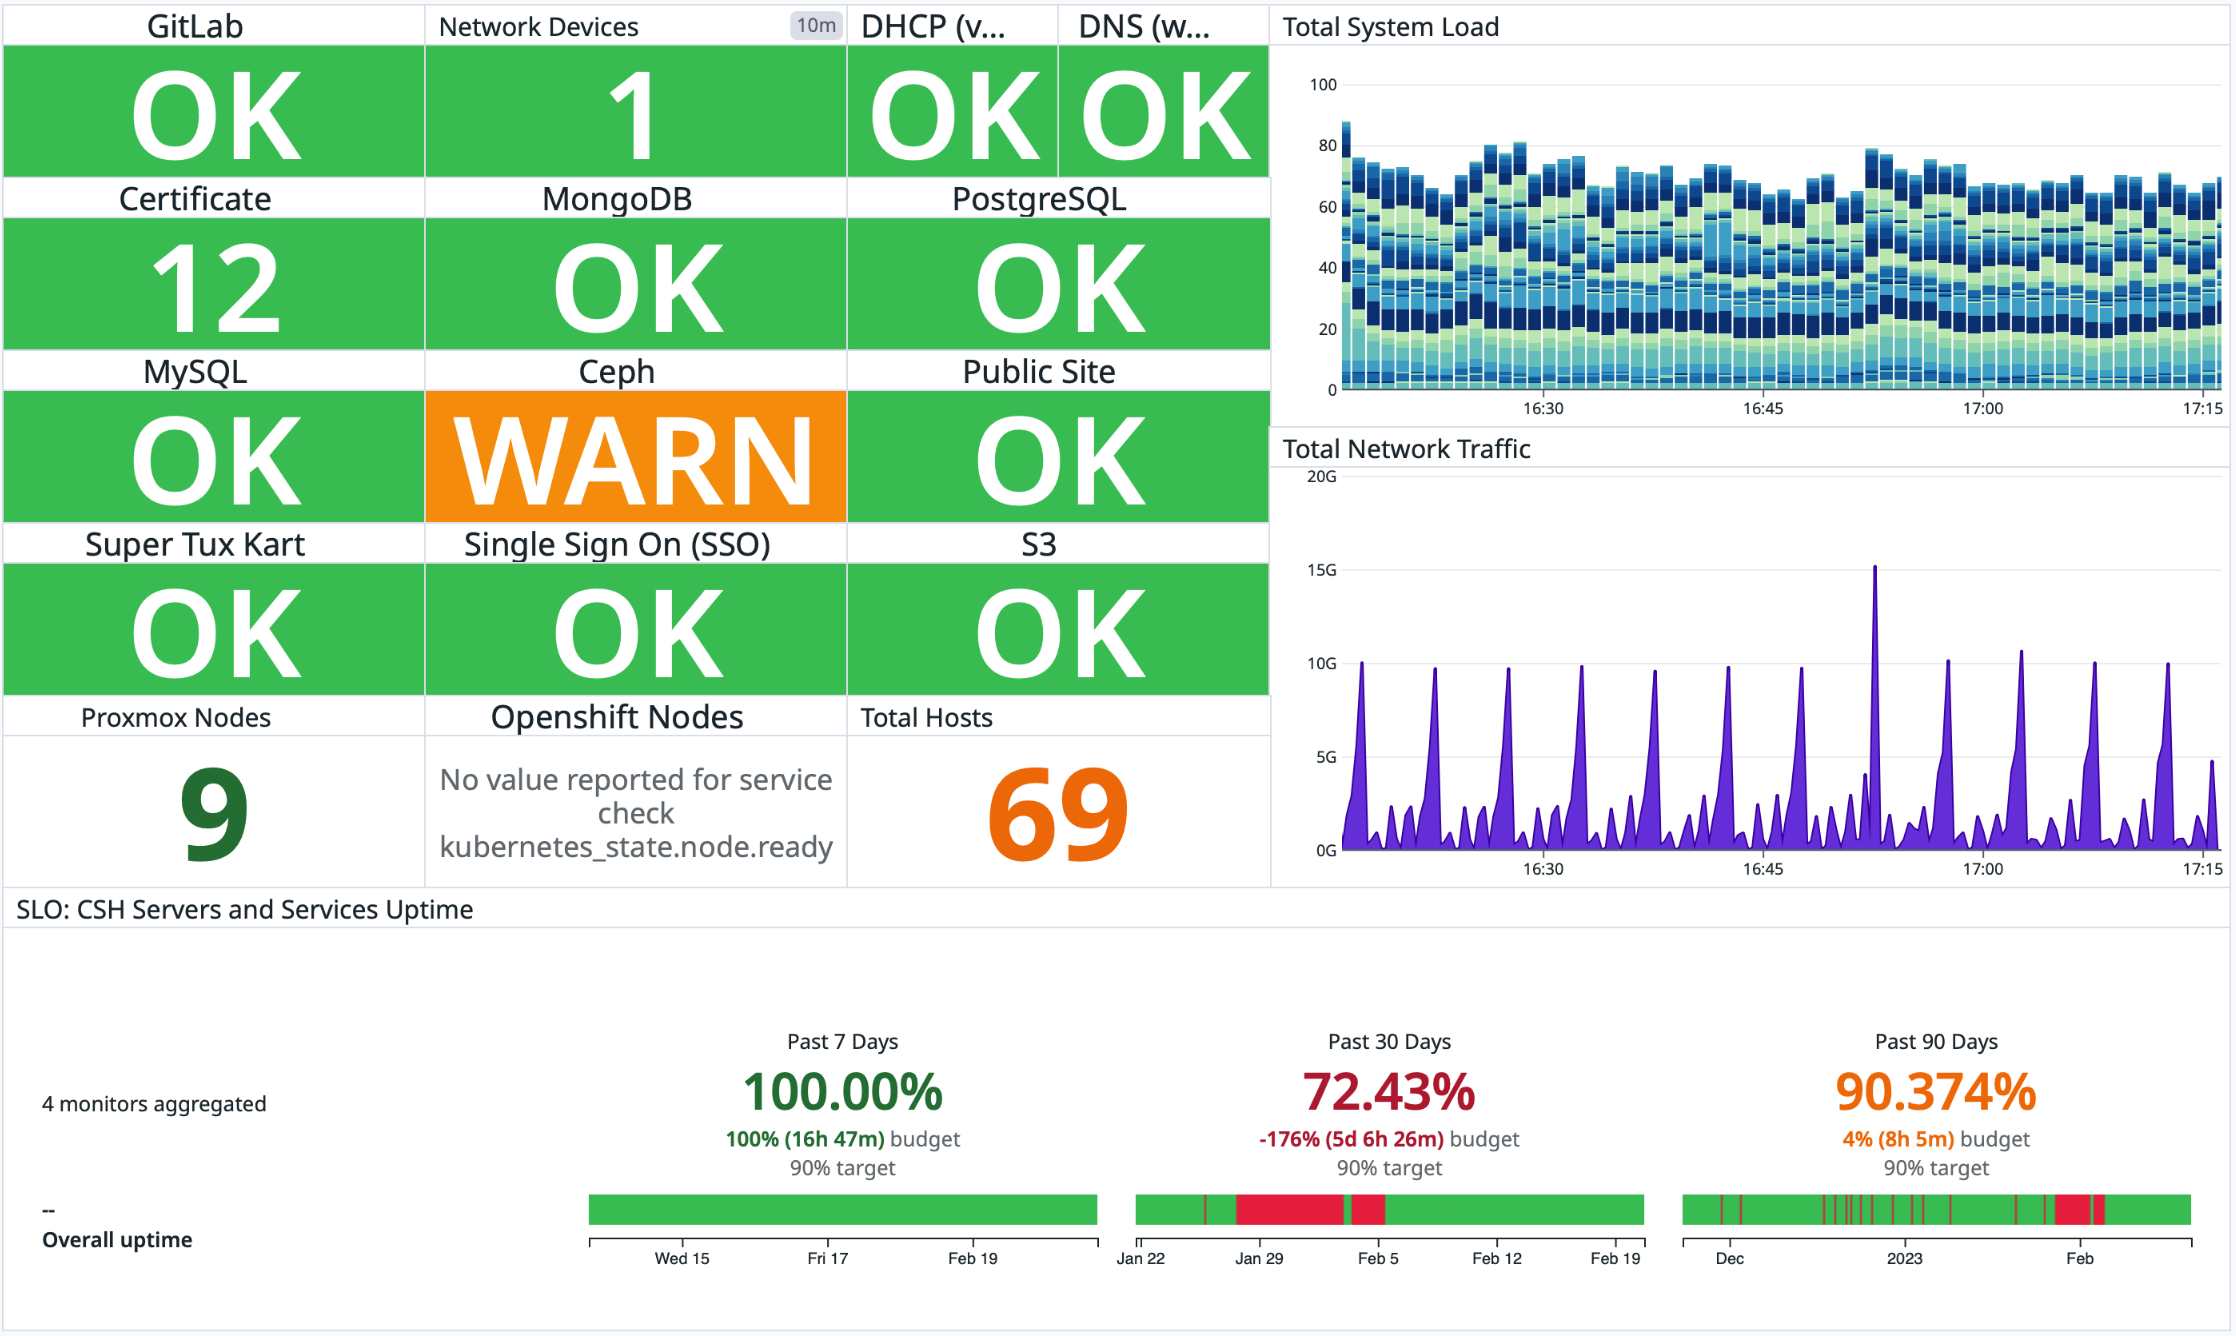
Dashboard and Slack Notifications
With all of these alerts and statistics, we need a way to gather and display it all. We have about 70 machines and many websites all producing data. To see all of this, we use dashboards that are displayed on our floor in RIT Dorms. When you get off the elevator to our floor, you can quickly see statistics of our infrastructure and identify if there are any current issues to be addressed. An example of our most popular dashboard is above!
Alongside this, we enjoy getting detailed, immediate alerts if something happens to go down. Since Slack is our form of communication across the organization, we have channels for Slack alerts. These are also able to be divided by severity or node, so we can pay more attention to alerts that may impact our core infrastructure before we handle a website with a bug.
Open Source!
Personally, I love any project that is open source so I can see how it works and find ways to contribute. A lot of Datadog’s code is available on Github, so it can be seen by anyone! In the past, I made a contribution to their MongoDB module to update the parameters used in a Puppet config to set up a database monitor for that server.
Future Implementations
We hope to add custom statistics to our Datadog dashboards in the future to get our members more involved and comfortable with the Datadog experience. A recent project in the works in an Arduino that will provide plant moisture levels for our plants across the floor. Once it gets the data, it will send a UDP packet to one of our nodes using DogStatsd. As we continue to expand our infrastructure, I can guarantee Datadog will be there to help us manage it all. We are college students, and we appreciate the help that Datadog gives us!
More blog posts